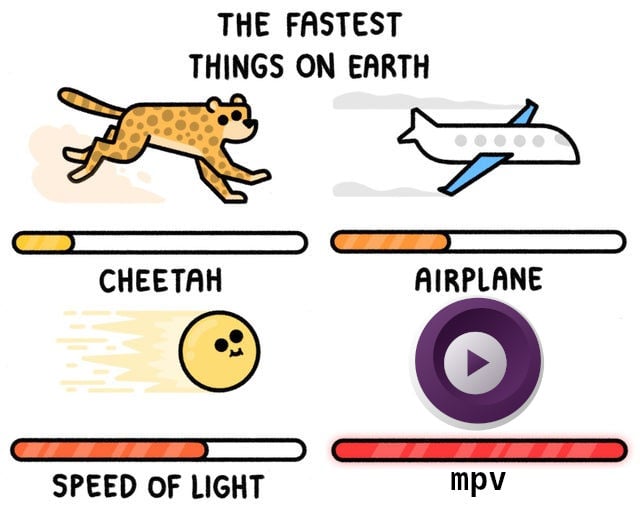
y=log_a(x) <=> x=pow(a,y) where “a” is unknown. Let’s say the values of the progress bars in the image are in ]0,b]. That puts the cheetah on about b/5. It is know that cheetahs run at a maximum speed of 75mph. This gives us b/5=log_a(75) <=> pow(a,b/5)=75 <=> a=pow(75,5/b) Therefore, we have the relationship x=pow(75,pow(5/b,y)).
For the speed of light, y=((b×3)/5). It is known that the speed of light is 671000000mph. That gives us x=pow(75,pow(5/b,(b×3)/5))=671000000mph <=> pow(75,pow(5/b,b))=514285405839088.
For the airplane, y=((b×2)/5). The fastest airplane flied at about 2200mph. That gives us x=pow(75,pow(5/b,(b×2)/5))=2200mph <=> pow(75,pow(5/b,b))=227016123.

y=log_a(x) <=> x=pow(a,y) where “a” is unknown. Let’s say the values of the progress bars in the image are in ]0,b]. That puts the cheetah on about b/5. It is know that cheetahs run at a maximum speed of 75mph. This gives us b/5=log_a(75) <=> pow(a,b/5)=75 <=> a=pow(75,5/b) Therefore, we have the relationship x=pow(75,pow(5/b,y)).
For the speed of light, y=((b×3)/5). It is known that the speed of light is 671000000mph. That gives us x=pow(75,pow(5/b,(b×3)/5))=671000000mph <=> pow(75,pow(5/b,b))=514285405839088. For the airplane, y=((b×2)/5). The fastest airplane flied at about 2200mph. That gives us x=pow(75,pow(5/b,(b×2)/5))=2200mph <=> pow(75,pow(5/b,b))=227016123.
514285405839088 =/= 227016123 (contradiction).
Cannot be a logarithmic scale.
it’s a double log… y = log(log(x))…
or maybe *graph not to scale